Current issues with ETH-USDC pool

Context

Over the past few months, our ETH-USDC DEX pool has established itself as a market leader in both trading volume and fees generated. However, during periods of sharp volatility, the current v1 design triggers rebalancing which incurs losses to LPs.

Description

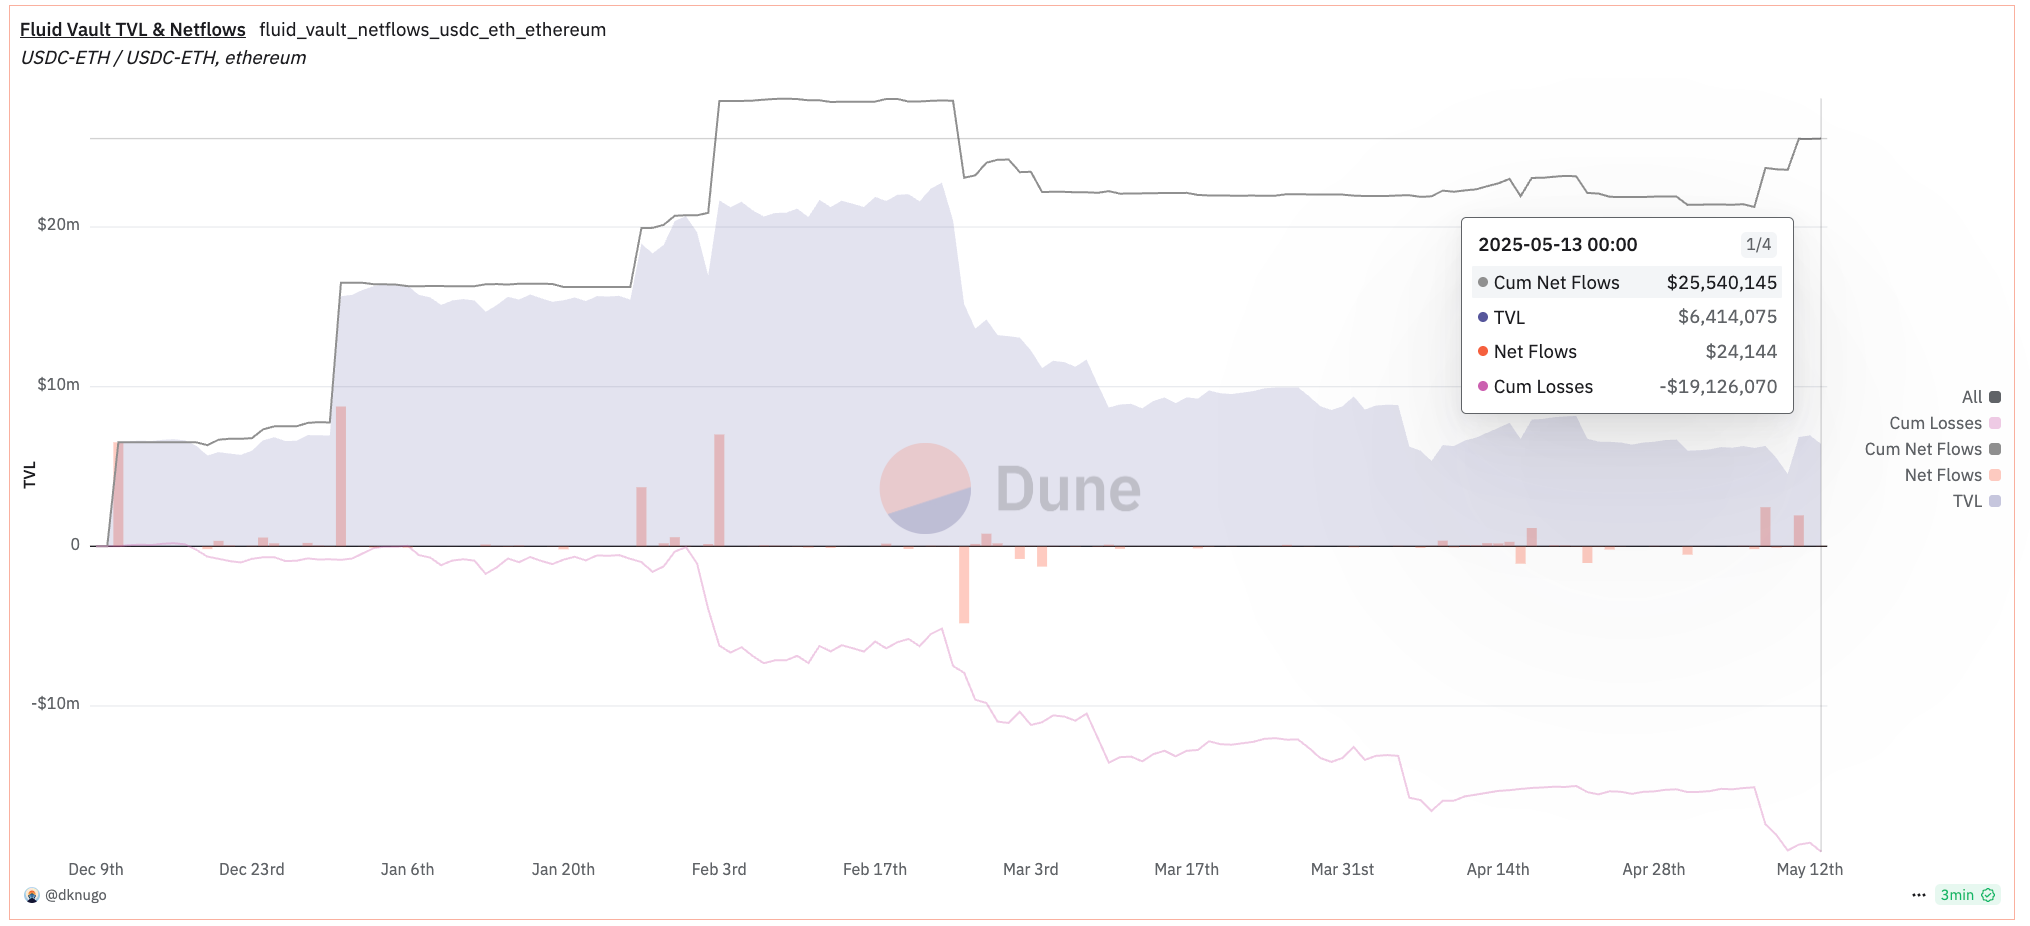
The ETH-USDC pool launched in late December with ETH at ~$4,000. Since then, ETH has experienced the most extreme volatility of the past two years — dropping to $1,400 and now trading around $2,600. Note: The fee generated on Fluid’s ETH-USDC per liquidity depth is similar to Uniswap’s ETH-USDC 0.05% pool.

While the pool performs exceptionally well when prices stay within range (accruing strong fees for LPs), high volatility triggers rebalancing. This happens gradually through trades routed via the pool — from ~$3,800 to ~$1,560, and now ~$2,340. The rebalancing mechanism incurs realized losses for LPs that outweighed fee income.

We believe the pool can perform very well in a more stable environment — it just hasn’t had the chance to prove it yet.

Perfect Solution

DEX v2, launching in June–July, designed specifically for:

  • Sophisticated Liquidity Providers
  • Dynamic LP strategies
  • Better performance under all market conditions
  • Dynamic fees

Quick fix

  • Vest 500,000 of FLUID token (0.5% supply) for a year to affected users of ETH-USDC DEX.
  • LPs who continue to provide liquidity will receive $400k $Fluid rewards per month until DEX v2 is live.
  • Updating the range of pool.

Update range

Current range is 30% wide (-+15%) where rebalancing starts to happen when price goes out of -+10% range.

Rebalancing path in current pool since December:

  • Launch at ~$3800
  • Bottom point: ~$1560 (~59% down rebalanced from 3800)
  • Current ~$2340 (~50% up from bottom) (12th May)

Scenario: Increasing range

Doubling the range to 60% wide (-+30%) where rebalancing will start to happen when price goes out of -+25% range.
Pros: Lower rebalancing hence less rebalancing related loss.
Fees: Half the fees per liquidity

Rebalancing path simulation:

  • Launch at ~$3800
  • Bottom point: ~$1866 (~51% down rebalanced from 3800)
  • Current ~$1950 (~4.5% up from bottom)

Rebalancing related losses will vaguely be half w.r.t to current pool and fees earned will be half as well.

Scenario: Decreasing range

Halving the range to 15% wide (-+7.5%) where rebalancing will start to happen when price goes out of -+5% range.
Pros: Higher rebalancing hence more rebalancing related loss.
Fees: Double the fees per liquidity

Rebalancing path simulation:

  • Launch at ~$3800
  • Bottom point: ~$1474 (~61.2% down rebalanced from 3800)
  • Current ~$2470 (~67.6% up from bottom)
    (Note: there will also be point with this where pool can have minor rebalances in up & down due to range being thin)

While rebalancing related losses will increase by around 20-30%, the fees earned per liquidity will increase by 100%.


Team’s preference

Team’s preference is to decrease the range to 15% doubling the fees which increases the rebalancing related losses by 20-30%. Team is also running some simulations which we will post soon and can take the final decision.

$FLUID

Currently, treasury holds ~30% of the $FLUID token supply. $FLUID’s current emission rates is around 0.2% monthly going to lending incentives of USDC & USDT. The Lending protocol is the only place where DAO distribute rewards. Currently $FLUID emission & governance revenue is almost at par - whereas emissions are static, revenue is going up every month to a state where protocol is set to become highly profitable in this bull run. So in general 0.5% FLUID vesting emission is something governance should be able to afford.

DEX v2 will make volatile pairs on Fluid very lucrative while in the meantime distributing rewards and experimenting on existing ETH-USDC pool can be highly beneficial to Fluid if the pool turned out to be highly profitable. This can exponentially increase Fluid revenue while allowing Fluid to lead the DEX market so much so that Fluid can become the biggest DEX in the industry. At the same time, user’s entering the pool should be cautious of the risks and understand that pool is still going through some experimentation.

Misc

  • Currently, we have kept BTC-USD pool on hold. While that pool is less risky & can be profitable due to high stability of BTC. We will plan to launch more volatile pools with DEX v2.
  • Most CEX-DEX arbitrageurs (Wintermute, SCP, etc) went live on Fluid by the end of March which contributes to 50% of volumes on ETH-USDC pool. Hence, before March the pool has lost on quite a bit potential volume and fee related to it.
  • The issue is only related to ETH-USDC pool. All other DEX pools have been working perfectly fine and are super profitable for users.

We’re fully committed to transparency and long-term value. We’re excited to share more details on v2 soon.

4 Likes

i support this - Fluid DEX v1 was overall a huge success. For stableswap pools it’s already good enough and has gained enormous market share. For volatile pairs it seems like LP’s require more flexibility and the market has been very unfortunate. However, I would say that the learnings were hugely beneficial in getting the design for V2 right.

Given the value this provided to Fluid and as a general gesture of goodwill to the most devouted early adopters of Fluid Protocol, I think the vested Fluid incentives will act as a nice compensation.

I also think it’s smart to let the pools run with incentives until V2 launches.

2 Likes

Firstly, I think the v1 experiment has been a huge success overall, however I’m a bit concerned that there aren’t any LP’s that are profitable in the ETH-USDC vault.
If you’re going to run a trading strategy for people, this is the main priority. In v2 where people can design their own, this is not of concern at all.

Knowing this, I would think the suggestion of the most conservative approach of increasing the range is best.

I know that this means that less fees will be earnt, and also Fluid will lose some PR/Marketing power of having such huge market share, but in times of volatility (that ETH has had the last week), I don’t think the fee increase can make up for the rebalancing losses, esp since many people are getting liquidated during such swings.

The incentives are definitely one solution to help keep TVL around, but it’s essentially just slightly boosting the PnL of all LP’s - again in the scenario where people are liquidated or losing massive money, it’s but a drop in the lake and doesn’t cover losses. Again, if the strategy was not run by the team, this is fine - but in this scenario I don’t think it is.

I eagerly await the results of the simulations that the team is running. If the tighter range can be shown to be profitable during volatility, then I’m all for it. But with the information we have right now, I would suggest the more conservative approach.
When running trading strategies on behalf of your LP’s, the first priority should be making sure they’re not bleeding.

Some questions:

  1. What’s the math behind compensation amount? 500,000 FLUID is approx $2.6M at current price. Cumulative losses in this pool were ~$19M since launch (see chart). Ofc not everything should be considered as “losses”: ETH price is still below ATH, some people were leveraging recklessly and were rightfully liquidated, etc. But still the difference is pretty high


    Source: https://dune.com/queries/4855794/8043079

  2. How $400k/month future compensation was calculated? Do you expect that LPs will incur ~$400k rebalancing losses next 2-3 months (till DEX v2 launch) at current pool TVL?

As for pool range it’s hard to make any decisions without extensive (back)testing. I’m sure the team made some backtests before launch and expected that LPs will be in profit. Then volatility rised significantly and LPs were rekt. The question is: was the previous approach to backtesting correct or were there any flaws in backtest algo that didn’t take into account some significant factors?

As an affected user I am happy to hear that this topic finally got some recognition beyond a few Discord replies.

I entered this pool at around $2400 ETH and had to leave it at the same price a few weeks later with -70% PnL. I used a healthy amount of leverage cis multiply but every +3% move led to huge losses as the rebalancing continuously led to losses no matter in which direction the price was moving. When ETH went down, the pool suddenly was hugely long eth, when eth went up the pool was suddenly extremely short ETH. I don’t see how this was supposed to work on an asset that is not stable. And as the pool attracted a lot of volume for Fluid and traction for the protocol in general based on the losses for the LPs, I really hope that there can be (1) reinbursements for the selected LPs and (2) better explanation in the docs and UI about the risks (don’t forget there was pretty much no warning and the treading APR was hugely advertised) and (3) improvements to mitigate the risks in V2.

Right now I feel very disappointed and left alone by the protocol. Please also make sure that users like me who had to close their position at some point with huge losses (a further rise in ETH would have totally wiped out my funds) get counted for any future distribution to make LPs whole.

Thank you for your understanding.

It’s complicated to quantify losses in this way as it’s not a normal LP positions rather it’s a leverage position where each user have different risk ratio. The similar kind of risk applies where if user holds ETH or goes leverage on ETH.

If user held 1 ETH when pool was launched (price around ~$4000 or deposited 1 ETH in smart collateral with no borrowings then current user’s position will be:
Losses in holding 1 ETH vs depositing 1 ETH on launch of pool:

  • Holding 1 ETH (from $4000 to current $2600). Loss in terms of $ value:1 - 2600/4000 = 35%.
  • On launch, 1 supply share = 2 USDC. Now it’s 1.26 USDC. If user deposited 1 ETH = 4000 USDC, now they would have 4000 * 1.26 / 2 = 2520 USDC. Loss equals to 37% (2% more than holding ETH)

Now there comes leverage, if users would have leveraged long ETH by 2x when price was at $4000 they would have been liquidated as ETH bottomed to $1400. In order to save the position users would have needed to deposit more ETH or payback debt in order to avoid liquidation. Similar risks comes with a leveraged LP position where debt is also being used as LP liquidity. These risks are decided by the user on how much leverage they should take and yes, as smart debt is a new concept so it can be confusing and ETH volatility has also been the worst since last 2-3 years.

So if users just had smart collateral the losses would have been minimal (near to no loss w.r.t ETH), with leverage it has exponentially increased.

Similarly, if you say a user leveraged long ETH 2x at $4000 and now price is at $2600 (considering user didn’t got liquidated) so user’s position would have been:

Initial position:

  • Collateral: 2 ETH * $4000 = $8000
  • Debt: $4000

Current position:

  • Collateral: 2 ETH & $2600 = $5200
  • Debt: $4000

Loss of about $2800 which is about 2800 / 4000 = 70% in losses from $4000 to now $1200.

Overall the losses of $19M are not true & cannot be quantified in this way as there are many nuances which are ignored in that.

1 Like

I think we should fix the ETH-USDC pool, or be extremely explicit under what circumstances it is a profitable strategy - instead of compensating with Fluid token.

500,000 $FLUID seems extremely generous considering the protocol did not generate that revenue from this pool. If anything (and I don’t think that’s the best approach, it serves as a band aid to a larger issue about pool profits) the compensation should = the revenue generated from that pool.

1 Like

First, thank you for addressing this issue and answering all of our concerns.

Here is a real example of loss that occurred to me on vault #4669 (had a second vault #4970 that was hit the same way) :

  • Created on the 9th of March (ETH price was 2020$) with 51.7 K$ split between USDC & ETH, used multiplier of 2.8x (which was considered safe) and I had a very low liquidation of 1400$ or something
  • Created my second vault (#4670) on that same day with 5.5K$ with a similar setup
  • Lost a large amount of found all the way while ETH was going down, the 52K$ turned into 28K$, which I guess make sense if the debt was in USDC mostly
  • But then the same thing happened all the way up, ETH went ABOVE my entry price and from the 30 K$ I had left in there I got liquidated because my debt was mostly in ETH instead of being held in USDC
  • Closed my position to save the little I had left or I would have lost everything above 2300$, I got only 8300$ out of the 52K and 883$ out of the 5.5K
  • Final loss of : 84 % (52K + 5.5K turned into 8.3K & 883$)

During the 2 months I held my positions I did not make any money at all and was just losing a bit more every single day. The rebalance mechanism should have switched the debt based on the current market behavior but it seems that the debt was always held on the worst side of the LP (held in ETH on the way down, held in USDC on the way up).

I’m glad you removed this pool from the UI, less users will be affected.
I hope some kind of compensation will be sent to users like me who lost most of their funds.

Vault #4669 :
Creation : [here](https://etherscan.io/tx/0x95551795ae779c1031dadda09afaea9723f0dd18d29b31c05f1d915a1c8414d0)
Exit of the vault : [here](https://etherscan.io/tx/0x61bcbae19c7985bb6fd20356e08df6d6d121d8a0187a97fa009b823e297febc1)
Final withdrawal : [here](https://etherscan.io/tx/0x2356699f2dad7d921c4d72d6c4657609eb5aa35425904d89d34d2468923bd381)

Vault #4670 :
Exit of the vault : [here](https://etherscan.io/tx/0x91eb24f1e7485d629a1e0e157de33e91c4ffab03da9153bb9ffef30503d21456)
Final withdrawal : [here](https://etherscan.io/tx/0xea8d767d28dafa1c616140a98aa0544f48e835659f14a32f018313c32824b0b0)

Analysis Report

Summary

Our analysis of the ETH/USDC pool across multiple time periods (3, 6, and 12 months) with varying fee assumptions reveals the following insight: concentrated liquidity faces a trade-off between fee generation and rebalancing costs that become more pronounced over longer time periods. The data demonstrates that while narrow ranges (5, 7.5%, and 10%) generate huge fee revenue, excessive rebalancing losses make them economically unviable, particularly in a volatile environment.

Note:

  • There are overall assumptions taken close to real market scenario. We expect the analysis to be 80-90% precise.
  • The analysis is till ~15th May.
  • Analysis results is attached for last 12 months. Last 12 months returns are much better than last 3 months or last 6 months as first 6 months ETH was relatively more stable than the next 6 months.
  • Pool performance for the last 30 days has been the best since the pool went live due to ETH price stability ranging around 2400-2800. Pool has earned around ~$2M in trading fees with no significant losses but since analysis is till 15th May this data is not included in it.
  • According to past data average pools trading ranges around 60x to 90x w.r.t liquidity of 1% range. So if pool has $1M in liquidity at 1% range then pool is expected to $60M to $90M in average daily volume at 0.1% fee. ($1M in 1% means $30M pool liquidity in 30% range).

Key Findings Across Time Periods

Performance by Range

Range Best Net PnL (12M Horizon) 60x Best Net PnL (12M Horizon) 90x Rebalancing Events Key Insight (60x) Key Insight (90x)
±5% -$30M (-100%) -$2.7M (-8.96%) 867-1310 events Completely unviable - total loss Still significant losses despite higher volume
±7.5% -$9.9M (-32.9%) +$10.8M (36%) 605-876 events Heavy losses Becomes profitable with higher volume
±10% -$0.7M (-2.19%) +$10.2M (49.7%) 461-670 events Moderate losses Strong profitability
±15% +$3.3M (+10.99%) +$13.7M (+45.66%) 272-395 events Near breakeven Excellent performance
±20% +$4.9M (+16.34%) +$12.7M (42.37%) 177-253 events Slight profitability Very strong returns
±25% +$7.7M (25.66%) +$13.9M (46.5%) 147-210 events Optimal Performance Consistent high performance
±30% +$9.1M (30.44%) +$14.3M (47.8%) 82-163 events Strong performance Strong performance

Cause Analysis: Why Losses Occur

Fee vs Rebalancing Trade-off

  • Fee Generation: Narrower ranges concentrate liquidity, earning 3-6× higher fees
  • Rebalancing Frequency: Narrower ranges trigger rebalancing 5-15× more often
  • Loss Magnitude: Each rebalancing event incurs substantial costs due to shifting center-prices and liquidity shifting locking in the Impermanent Loss
  • Volatility: The 12-month data shows that sustained volatility periods devastate narrow ranges:
    • 5% ranges: Up to 1,310 rebalancing events (3.6 per day)
    • 30% ranges: Only 82 events (0.2 per day)

Time Horizon Analysis

Short-Term (3 Months Data)

  • 5% ranges: Show pool losses in range of -38% to -77%
  • Profitable threshold: Ranges ≥20% show least negative returns compared to HODL

Medium-Term (6 Months Data)

  • 5% ranges: Deteriorate to -40% to -100% pool losses
  • Breakeven point: 10% ranges begin showing positive returns in optimal configurations
  • Performance spread: Clear divergence between narrow and wide ranges becomes evident

Long-Term (12 Months Data)

  • 5% ranges: Become entirely uneconomical with losses up to -100%
  • Stability: Wider ranges (15-30%) maintain steady performance
  • Insight: Long-term passive LPing requires conservative range selection for Volatile pairs

Key Learnings

  1. Time Amplifies Range Effects: Longer time periods make narrow ranges increasingly unviable due to cumulative rebalancing costs
  2. Volume is Critical: Higher trading volumes can make previously unprofitable narrow ranges viable, but this requires accurate volume forecasting
  3. Passive LPing Sweet Spot: >15% ranges represents the optimal balance between fee generation and rebalancing costs across all scenarios

The Fix

Conservative Range

  • Target Range: 15-30%
  • Expected Performance: 10-45% annual returns
  • Risk Profile: Low rebalancing frequency which will enable sustainable operation for Passive LPs
  • FLUID emission: Start the emission of 0.5% FLUID tokens over next 12 months in next governance proposal to all the affected users.

Conclusion

Our analysis helped understand that wider ranges (15-30%) with thresholds (0.16-0.25) provide the desired balance between fee generation and rebalancing costs for passive LPing. While narrow ranges offer theoretical higher yields, the reality of excessive rebalancing losses makes them unviable for sustained periods.

Recommendation: Keep the range same or increase slightly and monitor the performance.


Appendix

Methodology and Details

Market Conditions

  • Analysis Period: 12-month historical data. 3-Month and 6-Month not included extensively
  • ETH Price Extrema: $1,280.87 - $4,105.44
  • Price Dynamics: Captured major bull/bear cycles including significant drawdowns and recoveries

Simulation Framework

  • Price Data: Historical ETH/USDC price movements batched with 5 minute-level granularity
  • Volume Assumptions:
    • 60x Scenario: Baseline volume assumption where 30% range width generates $60M daily volume. Other ranges scale accordingly
    • 90x Scenario: High volume assumption where 30% range width generates $90M daily volume (50% higher). Other ranges scale accordingly
  • Volume Scaling: daily_volume = baseline_volume × (30% / range_width). Narrower Ranges → Denser liquidity → proportionally more volume routed through it
  • Rebalancing Logic: Automatic rebalancing when price moves beyond the bound prices from center price
  • Fee Calculation: 0.10% trading fees distributed to in-range liquidity providers
  • Initial Liquidity: We start with $30M in Pool Liquidity with reserves in 1:1 Ratio
  • HODL Return: -$4.7M (-15.70%) over the 12-month period
  • HODL (ETH Only) : -$9.4 M (-31.4%) over the 12-month period
  • HODL (USDC Only) : -$0 M (0%) over the 12-month period

Key Metrics

  • Net PNL: Relative performance comparison showing how much better/worse the LP strategy performed vs simply holding equivalent ETH/USDC
    • Performance vs HODL = LP Strategy PnL - HODL Strategy Return
  • LP Strategy PnL: The actual return experienced by liquidity providers. It accounts for impermanent loss, fee collection, and rebalancing costs
    • LP Strategy PnL = Cumulative Fee Revenue - Cumulative Rebalancing Loss
2 Likes